Optimise Snowflake usage and costs
Free Qlik Sense app to optimise Snowflake
Leading cloud data platform providers such as Snowflake have rapidly established themselves as essential components of modern data architecture and as extensions of data pipelines for companies worldwide.
Snowflake, and other cloud data vendors, are known for their scalability, flexibility, and pay-as-you-go pricing models. However, that pricing flexibility does mean that controlling costs efficiently requires insights into usage patterns, query performance, and resource allocation.
In an effort to assist Qlik customers in cost management, Qlik has collaborated with Ometis to develop a cutting-edge cloud platform analytics app, specifically tailored for Snowflake.
Leveraging the robust capabilities of Qlik's Associative Engine, the app uncovers invaluable insights within Snowflake's intricate metadata that traditional query-based tools, including Snowflake's built-in reports, simply cannot unveil. This will enable companies to optimise Snowflake usage and costs.
What's more ... for Qlik customers IT'S FREE!
Please view our recent webinar at which we introduced the app and went into the approach taken, the architecture used and also issues and considerations we had to overcome.
Overview
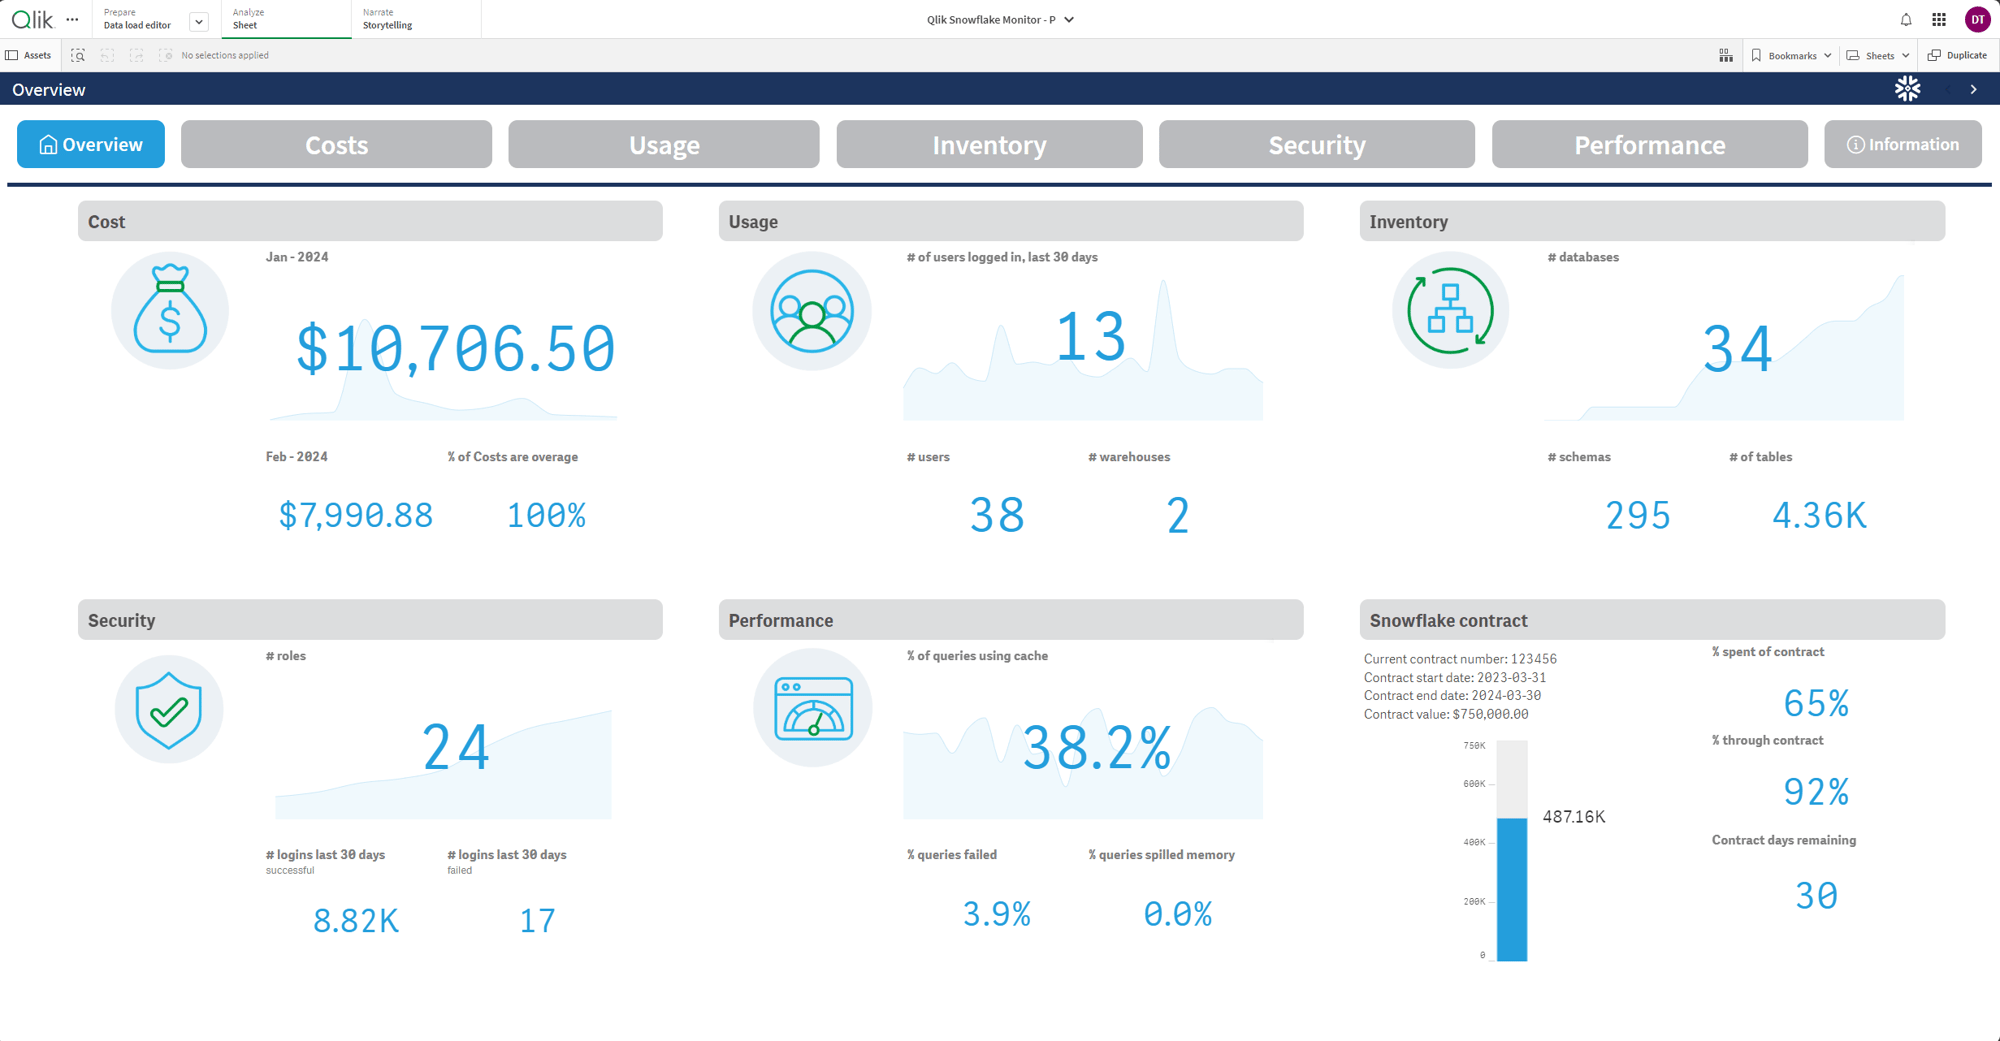
The initial focal point of the Cloud Platform Analytics for Snowflake dashboard offers an overview of key KPIs being tracked, along with a glimpse of your contract status to ensure spending is aligned. By simply selecting a KPI of interest, you can delve deeper into your Snowflake environment.
Note: This dashboard is compatible with both the Standard and Enterprise versions of Snowflake.
Costs
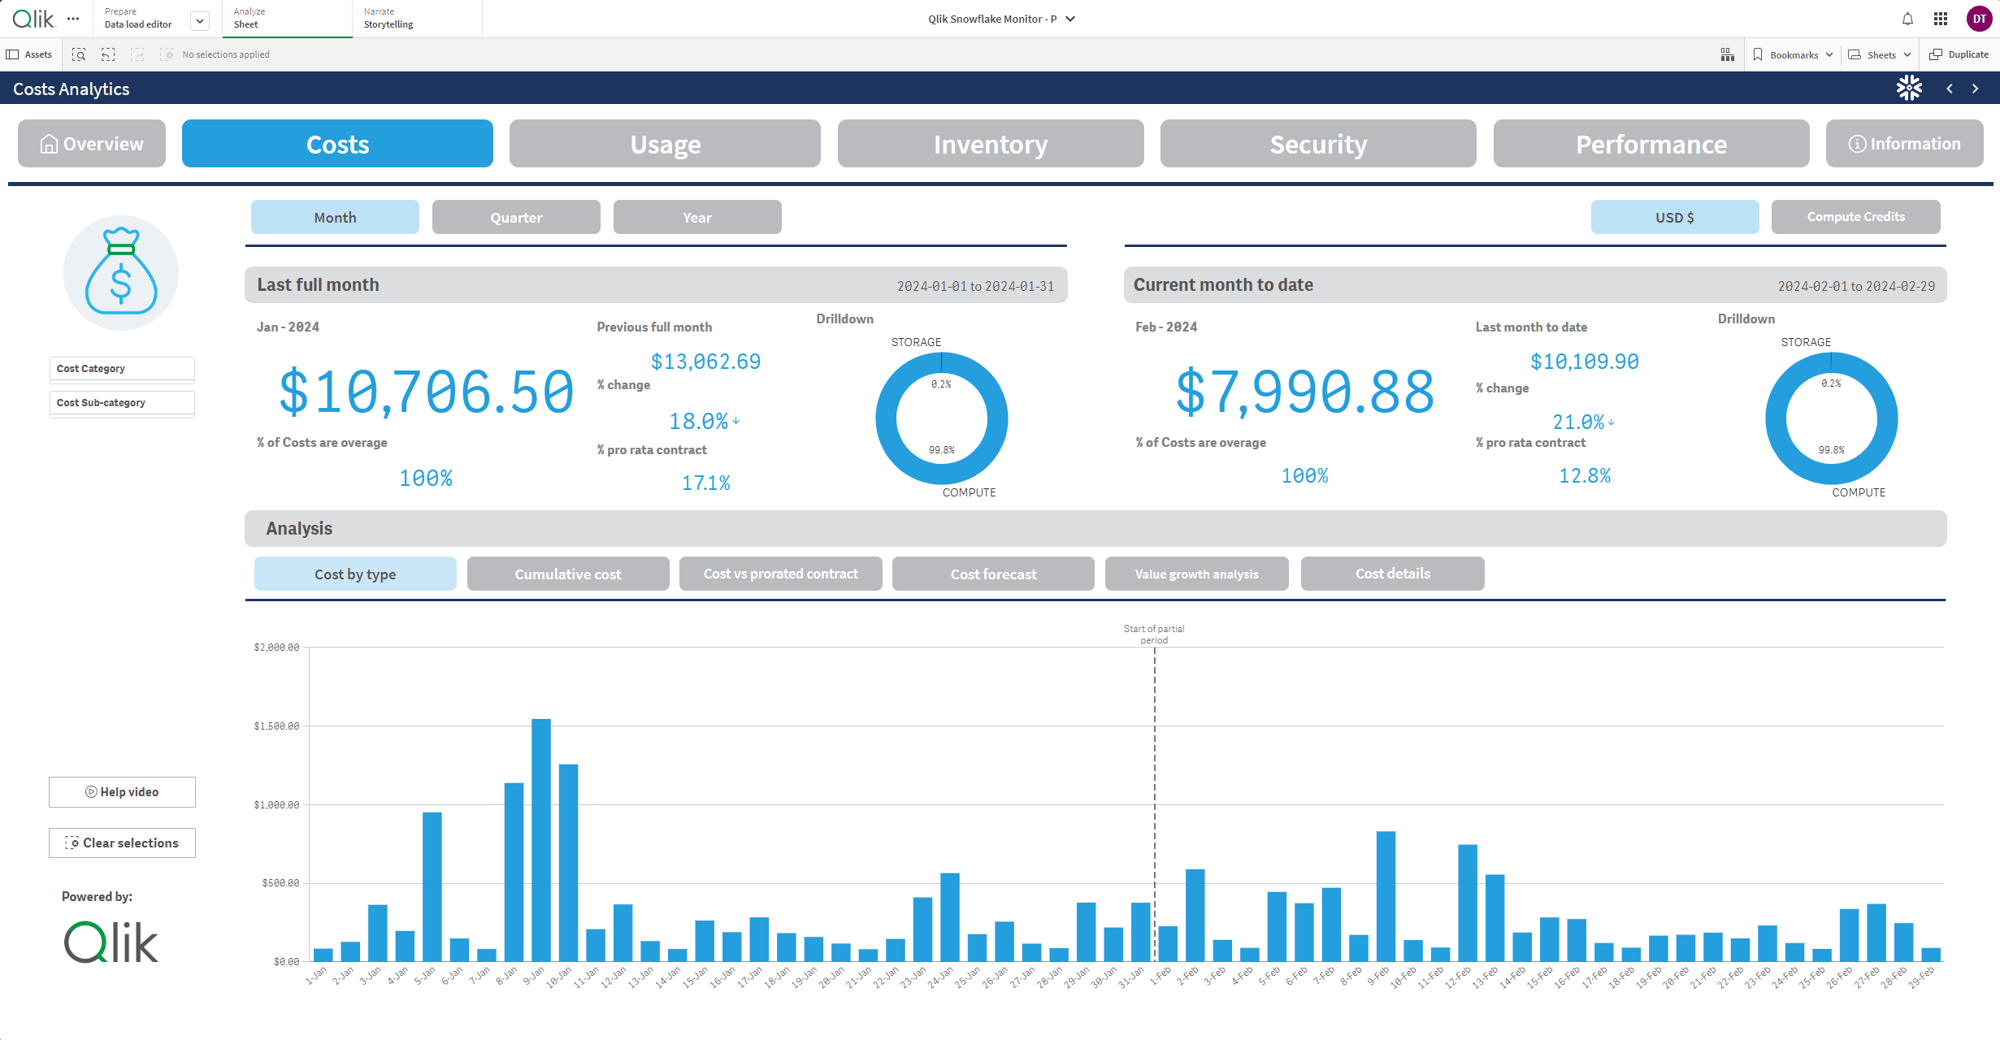
The Costs view provides a detailed analysis of your expenses over time, allowing you to compare them with previous periods. Dive deep into your costs by examining Users, Databases, Roles, and more to uncover potential cost-saving opportunities within your Snowflake environment.
Additionally, explore a value growth perspective to identify areas where costs are either expanding or contracting across key dimensions.

Usage
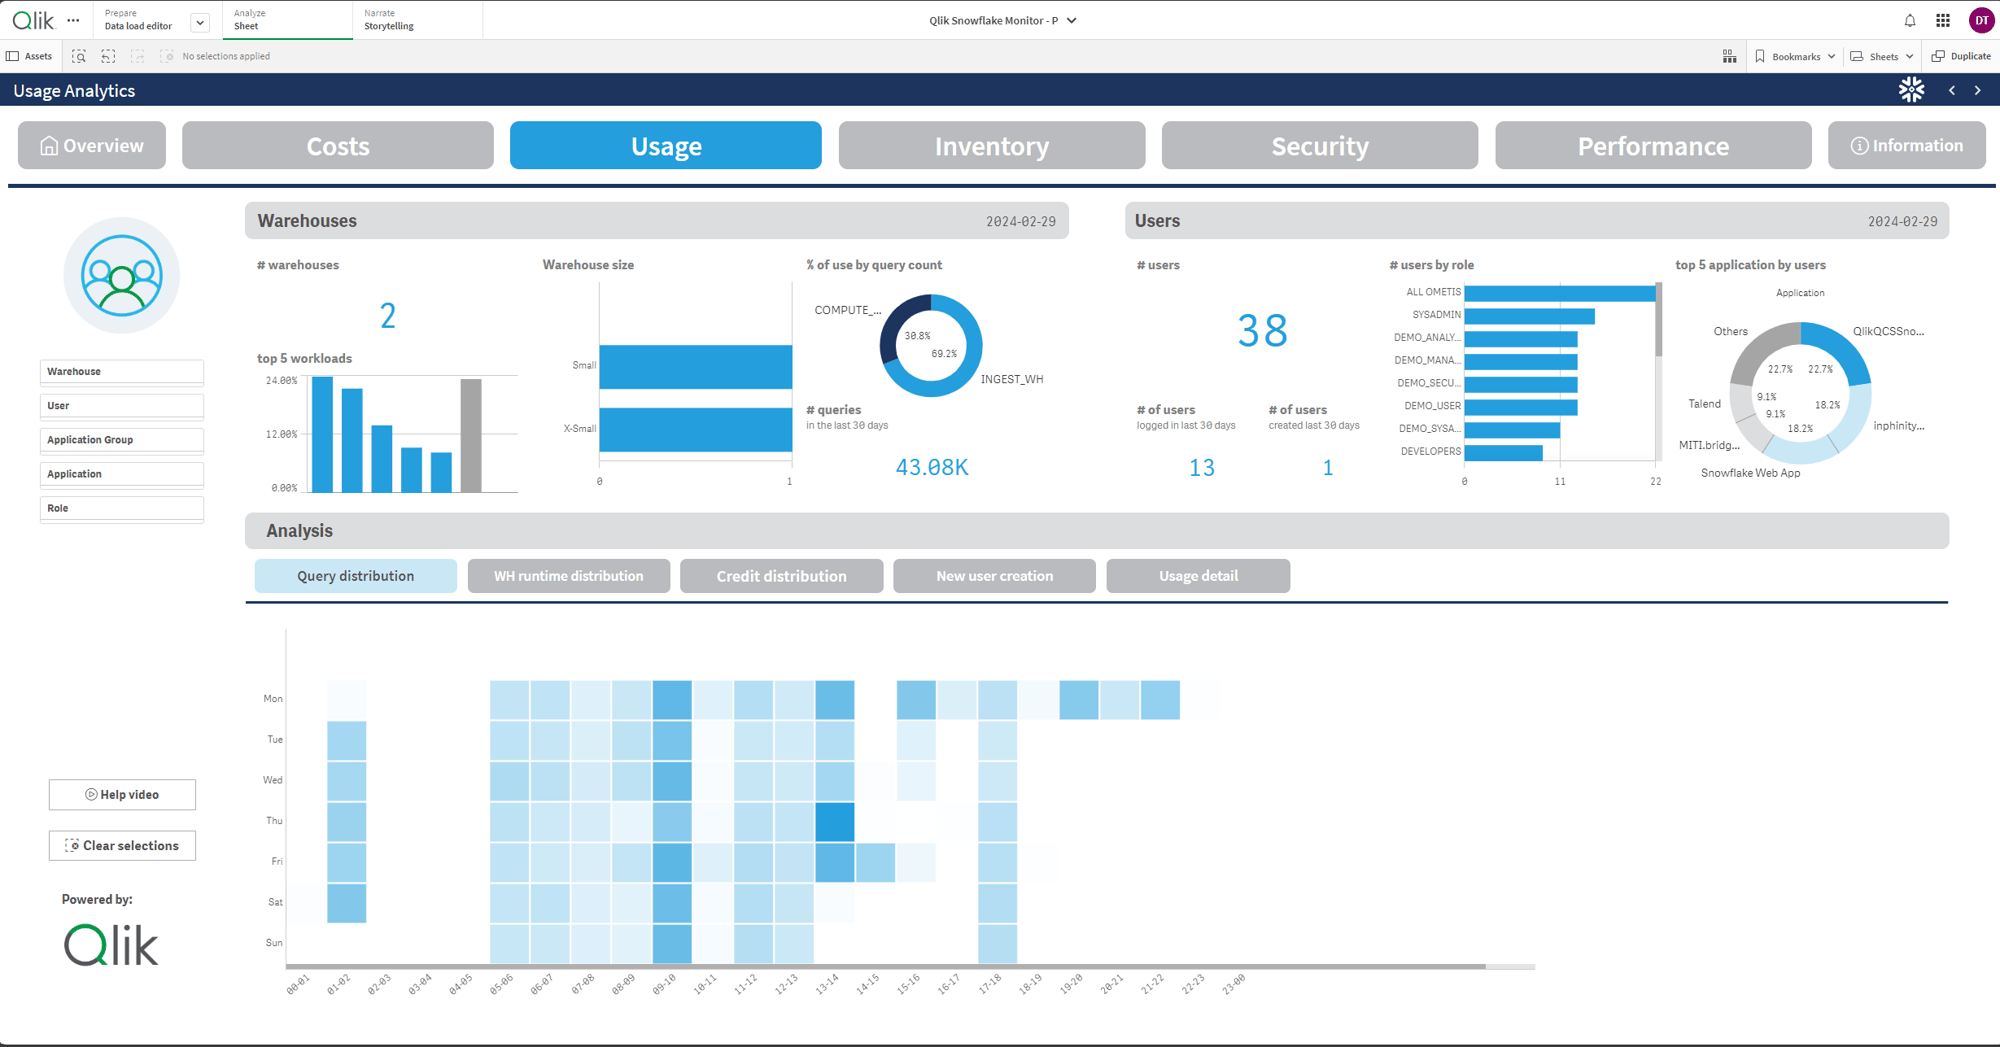
The Usage dashboard delves into your warehouse and workload activities, analysing query volumes over time to pinpoint peak usage periods within your warehouses. This insight allows for identifying opportunities to streamline queries across fewer warehouses in your Snowflake environment.
Additionally, you can track your most engaged users and the frequency of their queries, providing valuable information on their activity patterns.
Inventory
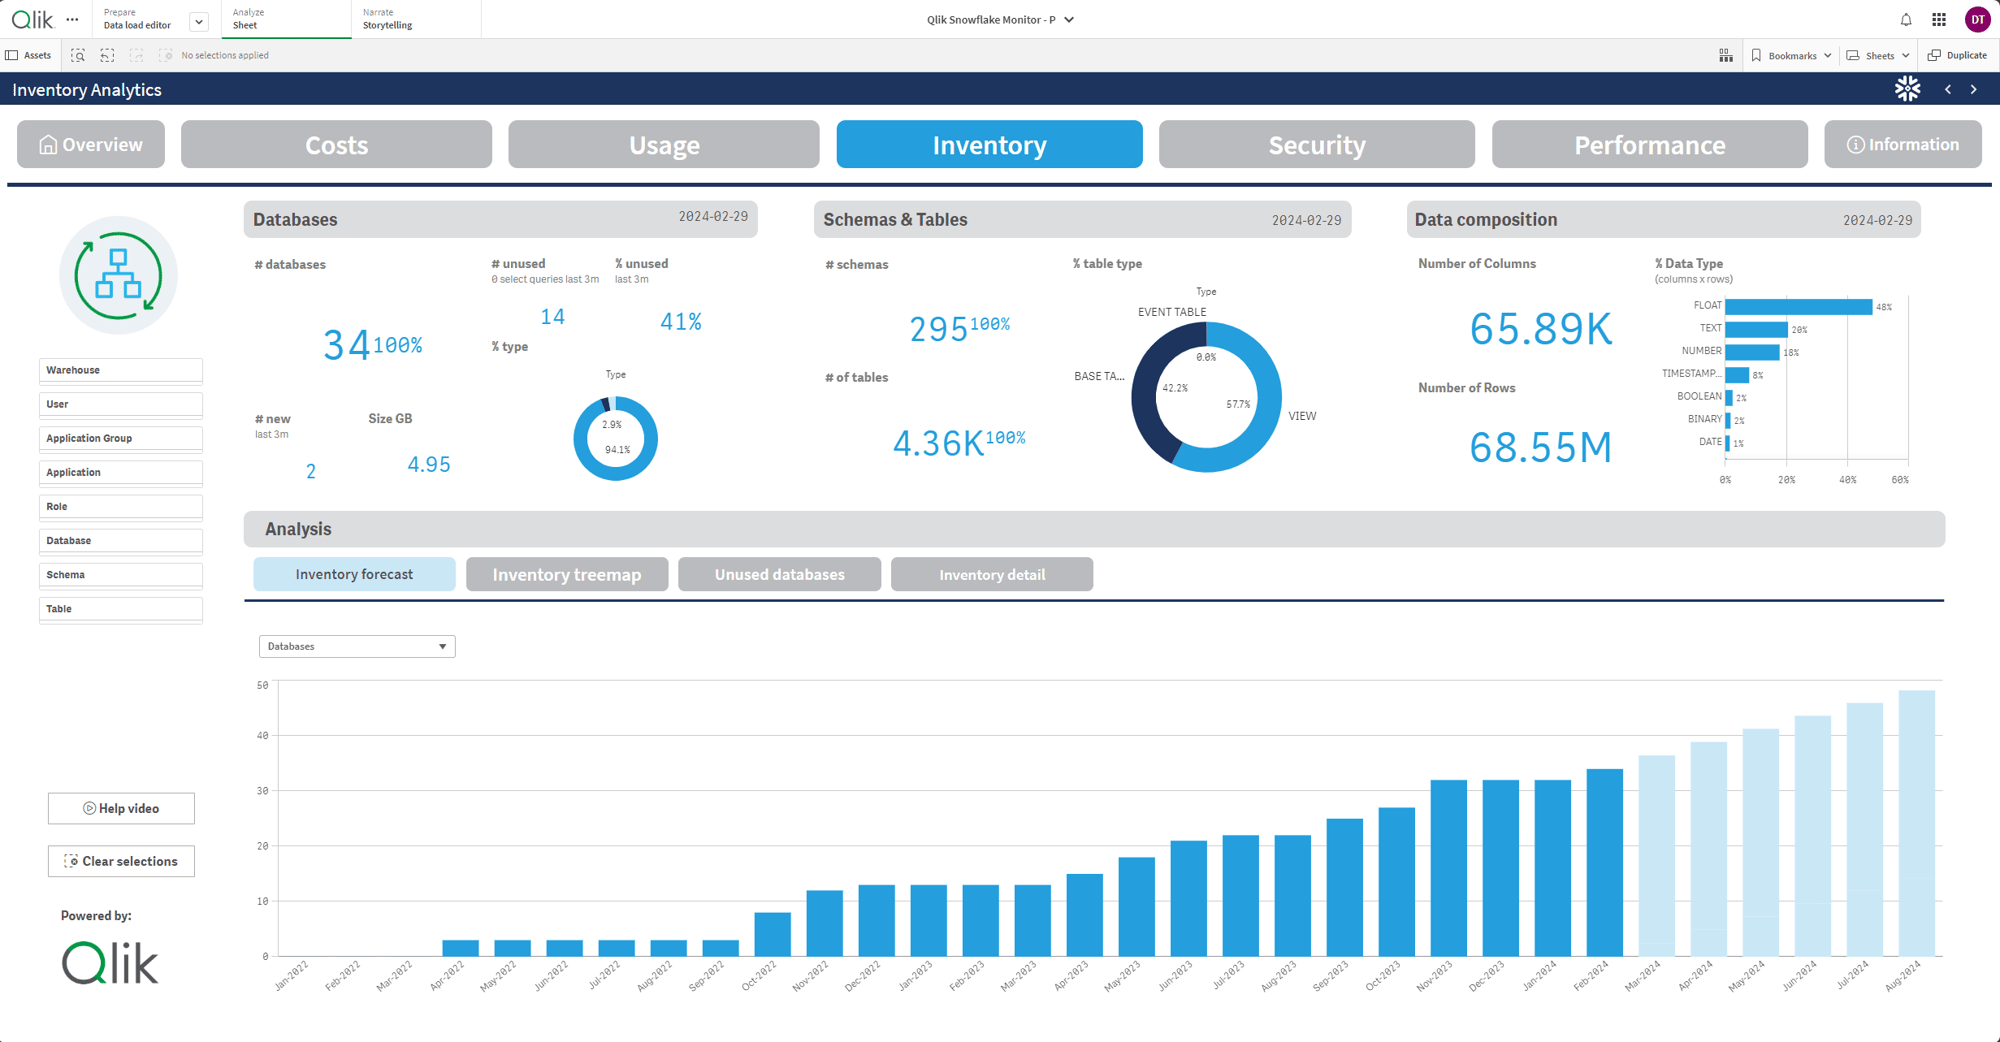
The Inventory sheet offers a comprehensive view of your databases, schemas, tables and views, providing an useful overview of your data and tracking its growth trends. Users can easily filter through their environment to see which inventory items they have access to.
Additionally, uncovering unused databases within this view can potentially identify areas where storage costs can be optimised.

Security
The Security view provides a comprehensive overview of your roles, users, and RBAC permissions, allowing you to identify who has access to specific items. Leveraging the power of the Qlik Associative Engine, this feature enables easy filtering of database objects to understand access control.
Additionally, you can track login history trends to monitor how users interact with your system.
Performance
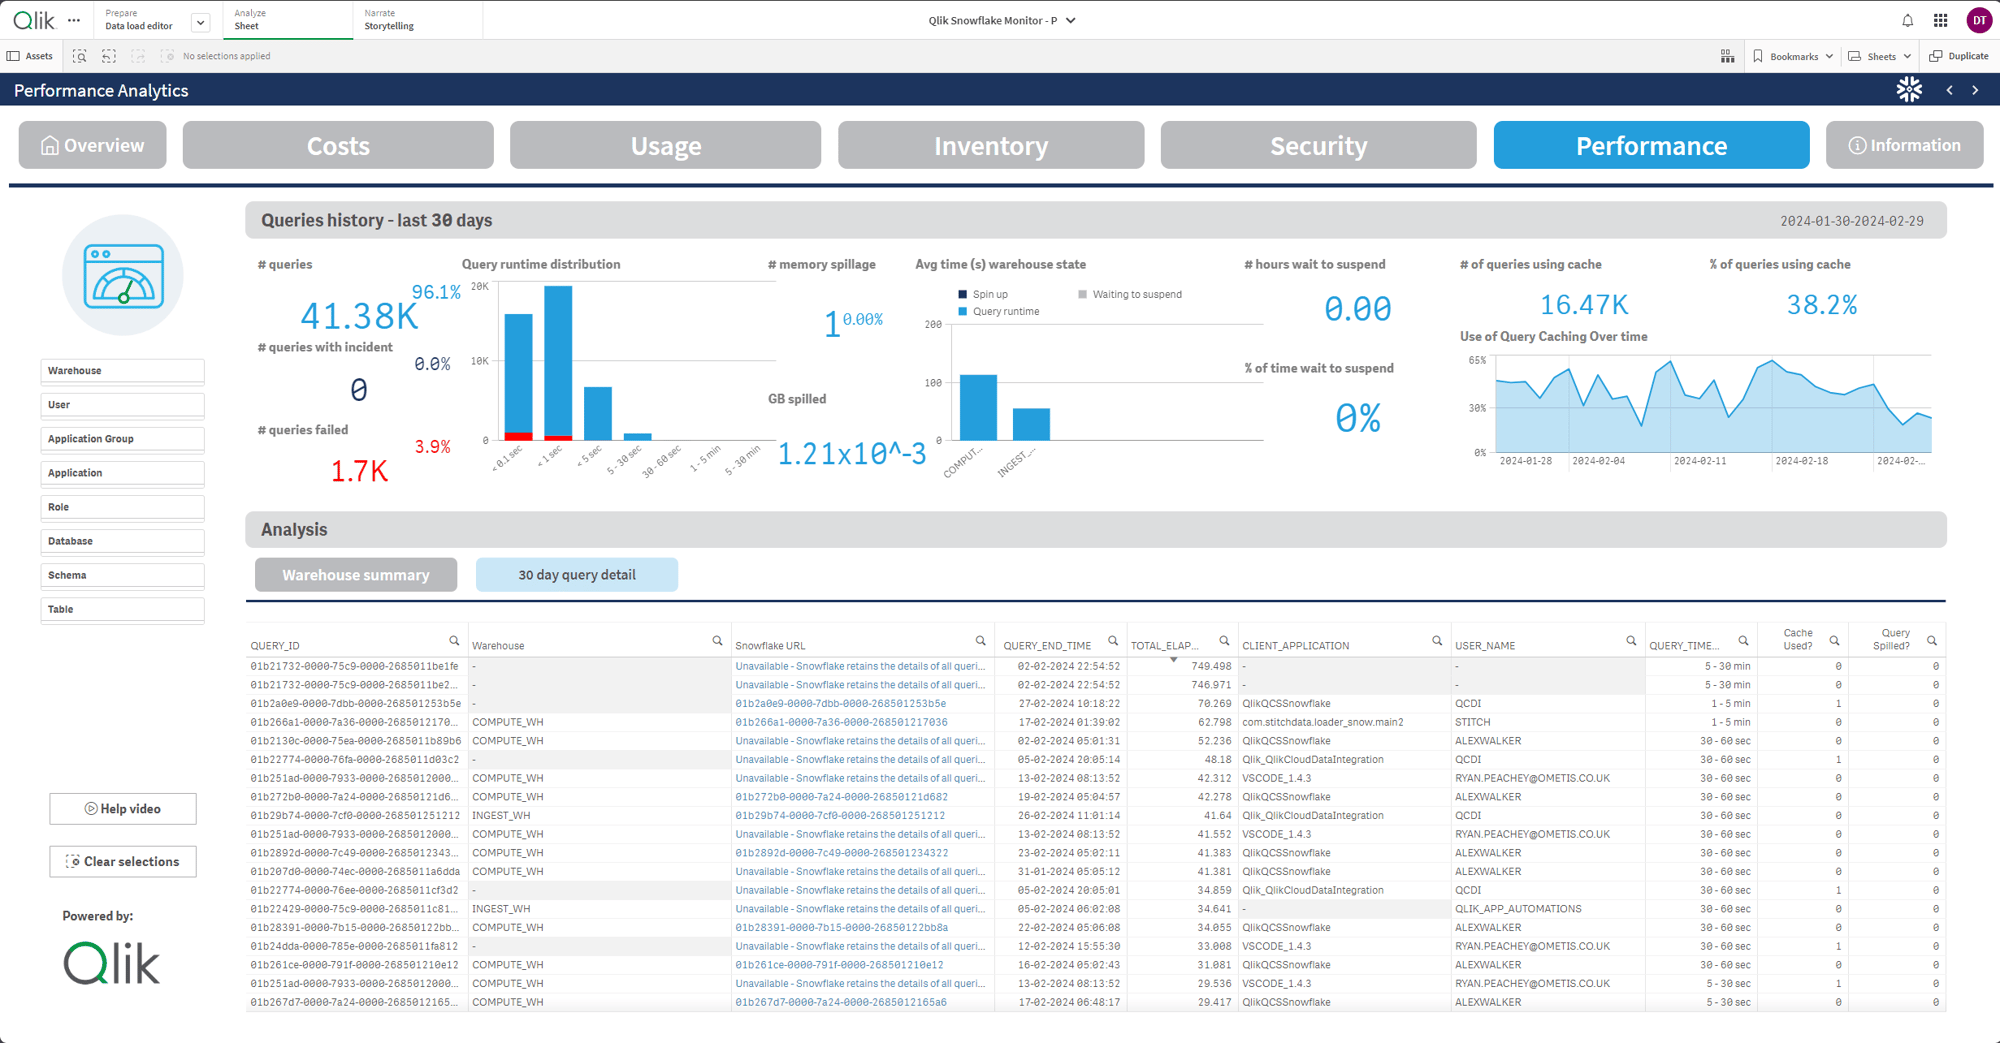
Performance metrics within Snowflake are crucial for optimising query performance. By analysing which queries utilise caching and identifying where queries are spilling to remote or local storage, you can effectively optimise your warehouse sizes.
Additionally, monitoring warehouse suspend times can help uncover further cost-saving opportunities within your Snowflake environment.
Schedule a Demo
What can you expect?
In short, we offer a simple, honest and interactive demo.
A typical agenda:
- Introductions (5 minutes)
- What are your current challenges (5 minutes)
- High-level slides inc. pricing (5 minutes)
- Product demo and continuous Q&A (40 minutes)
Outcomes:
- An in-depth technical demo
- A link to pricing and a bespoke proposal
But, this is your meeting, your time, so feel free to focus us on what you need from the call.


