Visualisation and dashboards
Turn data into an engaging and dynamic experience
Endless possibilities and no coding required
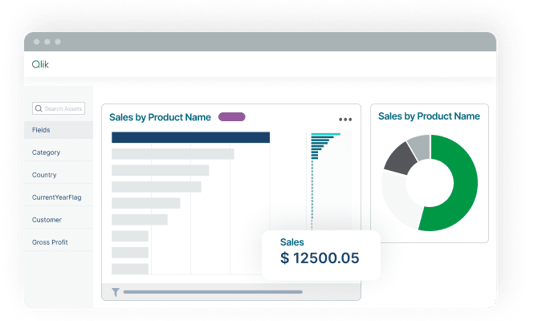
Explore a world where your creativity knows no limits, thanks to new settings and features that unlock endless possibilities with charts, sheets, and applications.
Say goodbye to coding or integration hurdles—embrace the freedom of visual expression like never before.

Farewell to frustrations
Say goodbye to the frustrations of adjusting CSS and relying on external plugins. With Qlik, you can customise your visual presentations with ease and simplicity.
Defying conventions
Embrace creativity and think outside the box. Explore non-grid frameworks, layer components uniquely, and create custom colour palettes. Let your imagination roam freely without limitations.
Breaking boundaries
Discover the power to easily customize UI settings by utilising layout containers to craft your data stories. No coding experience required.
Inspiration through AI-powered dashboards
In today's fast-paced world, creating dashboards has never been easier thanks to Qlik. Qlik's integration of artificial intelligence with its innovative Associative Engine unlocks a treasure trove of insights within your data, leading you to discover answers to questions you never knew you had.

See ya later, SQL
Instead of "querying," you simply ask. Whether it's a straightforward question or something more complex, this amazing technology helps you explore deeply to uncover your answers.
Leverage all of your data
All your data sources are unified – regardless of their quantity, size, or flaws. Connections become clear. Interactive analytics are activated. Everything is accessible.
Work smarter not harder
Effortlessly choose from any object, in any direction, to enhance your understanding and reveal fresh perspectives. Enjoy quick calculations on a large scale.


