10 Tips For Using Qlik NPrinting
In the latest Ometis blog, 10 Tips for using Qlik NPrinting, Chris Lofthouse provides a helpful list to get the most from your software.
Qlik NPrinting streamlines the creation and dissemination of static reports to both internal and external recipients. To assist you in maximising the potential of this platform, I have created a list of 10 valuable tips for effectively utilising Qlik NPrinting.
Qlik NPrinting relies heavily on a Qlik app to gather data and visuals for report templates. For this reason, it is crucial for Qlik developers to ensure that the Qlik apps are NPrinting-friendly. Additionally, while NPrinting reports remain static, Qlik apps are often dynamic. Therefore, I have compiled a set of tips and tricks to make working with Qlik and NPrinting easier.
10 Tips For Using Qlik NPrinting

|
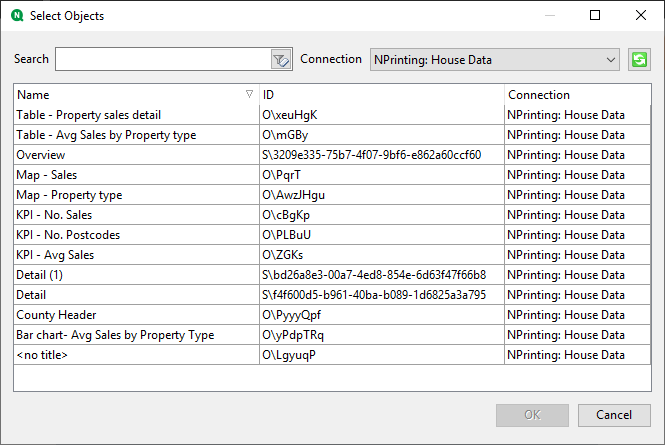
Provide titles for all objects you intend to use. By adding a title, it makes it easier to identify the object you want to add in Qlik NPrinting. You can hide the title and NPrinting will still pull it through. When adding a title, it’s best to specify the object type where possible, followed by a description. For example, ‘KPI – Max Sales’.
|

|
If possible, design the sheet and objects to match the layout and size they will have in the report. This can reduce trial and error for obtaining the best aspect ratio for your Qlik NPrinting reports. |

|
Remove any unnecessary text from the object i.e. titles, legends and/or axis labels. As the reports are static, these items are often unnecessary and can make the report look noisy – distracting from the message. |

|
Use colours that are consistent throughout the report. Most reports are used to communicate findings, rather than analysing the underlying data. Therefore, it is more common to use colour to corporatise the look of a report than for other purposes i.e. colouring as a measure. |

|
Where possible, hide scroll bars on objects. Recipients of static reports can’t interact with the visualisations, so scroll bars add nothing but noise to the report. It will also give the visualisation more space to display. |
 |
Avoid using visualisations which struggle to show all value labels i.e. distribution plots. Otherwise you risk recipients wondering what the dots mean, which offers little insight. |
 |
To ensure Qlik NPrinting renders the image as you see the Qlik dashboard sheets/images, set the Data Displayed Height and Width to that of your monitor resolution. For example, I set mine to 1920 px (Width) x 1080 px (Height). |

|
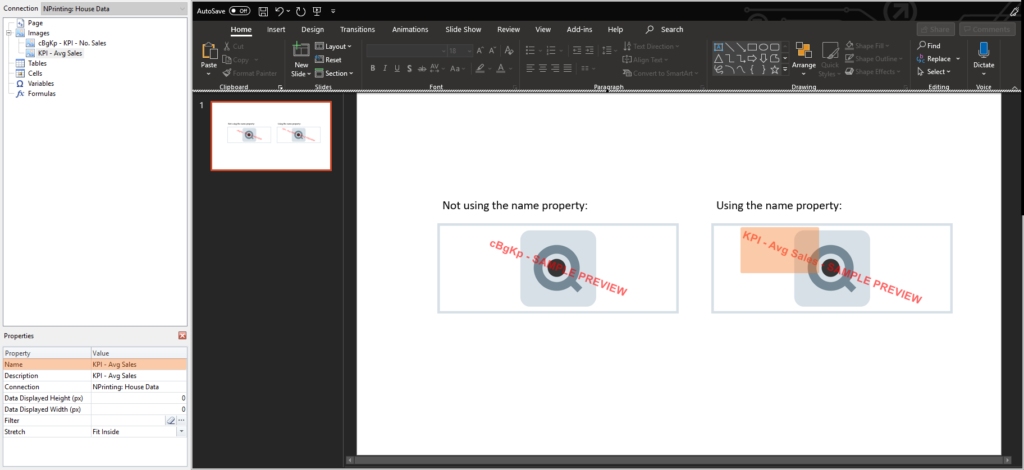
Do make use of the name property. It makes it easier to identify which placeholders are associated to each object. It also improves the robustness of the report, as you can switch objects without changing the placeholders. For example, if you want to change the object powering a placeholder, you would only need to remove/rename the old object and import the new object, naming it the same as the placeholder and Qlik NPrinting will handle the rest.
|

|
Qlik Sense specific: Another helpful tip for effectively utilising Qlik NPrinting is to create NPrinting specific apps. By doing so, you can streamline the development process in NPrinting compared to connecting to multiple Qlik apps, which may impact performance. This approach also allows you to reduce the number of Qlik apps you need to maintain. It's important to note that Qlik NPrinting imports objects from work, community, and base sheets of published apps. Therefore, you can create NPrinting specific sheets within a published app that are not visible to Qlik users, as long as they are not published to the community. This is a solution that has been successfully used before, and we recommend changing the owner of those sheets to the service account to prevent unintentional changes or deletions. |

|
When distributing reports via e-mail, do link back to the Qlik Sense applications. It offers your Qlik users a seamless experience and promotes user adoption. |
Hopefully you will find these tips and tricks useful for your implementation of QlikView/Qlik Sense and Qlik NPrinting. If you have any others please share them in the comments section below and we may add them to the list!
If you’ve found this article helpful, please be sure to like and follow us on Twitter, LinkedIn and YouTube, allowing us to continue to contribute to the Qlik community.
By Chris Lofthouse
Follow @clofthouse89
Topic: Data analytics




Comments