

Measuring data quality at scale requires systematic metrics that everyone in your organisation can understand.
Qlik Talend Cloud provides these metrics through Trust Score, a comprehensive framework for assessing data quality across seven dimensions.
I’ve been using Qlik Talend Cloud since its release, and it’s been great to see how it has evolved, especially since Qlik acquired Talend in May 2023.
In this guide, I’ll give you a practical introduction to Qlik Trust Score, the seven dimensions behind it, and how it shows up in data products and the data marketplace.
From Talend Trust Score to Qlik Trust Score
If you’ve used Talend previously, you’ll remember the original Talend Trust Score, which measured trust using five key dimensions.
In Qlik Talend Cloud, the experience has evolved into Qlik Trust Score, with seven dimensions now available.
This evolution reflects growing requirements around AI readiness and data adoption, with trust being now something you can quantify to help you focus on what matters to your organisation.
Qlik Trust Score dimensions (seven metrics explained)
Qlik Trust Score is made up of seven dimensions.
Two of these are mandatory, and the remaining five are optional, depending on what matters most to your business.
It’s up to you to define the weight of each dimension, making sure that the total of all dimensions is 100%.
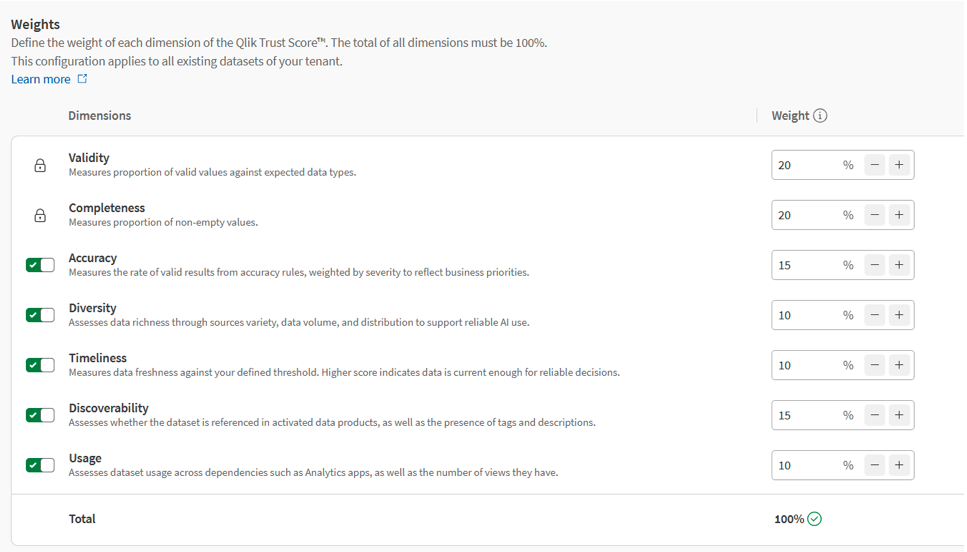
Here is a short introduction to each trust score dimension:
- Validity (Mandatory): Checks your data against Semantic types or expected data types in the column. This is useful when you need to confirm you have the correct data in your datasets.
- Completeness (Mandatory): Are we missing data? Completeness highlights missing values and nulls in datasets where values are expected (or at least a consistent placeholder like ‘Unknown’).
- Accuracy (Optional): You can build your own rules that can form part of the ‘accuracy’ of your data. This might be a simple validation (such as “value must be less than 5”), or more complex logic spanning multiple fields.
- Diversity (Optional): Diversity is designed to help assess how suitable a dataset is for use cases such as AI. It evaluates elements like variety, volume, and distribution.
- Timeliness (Optional): Data is no good if it's old, right? Timeliness reflects whether the dataset is being updated frequently enough to remain useful. You can set how often the data should refresh and this score will check on that for you.
- Discoverability (Optional): Discoverability looks at whether a dataset is easy for others to find and understand. It considers elements such as tags, descriptions, and whether the dataset is included in a data product.
- Usage (Optional): Usage tracks whether datasets are actually being used. This measure will see how many people are looking at and using this dataset in Qlik app, Data prep, and QTC projects.
This is just a quick summary of the metrics you can have to determine your Qlik Trust Score, but what does it look like in practice?
Viewing your Qlik Trust Score in data products
Trust Score becomes even more useful when you start grouping datasets into data products.
A data product is a group of datasets that form a model that users can further use in the Qlik product. They can be very powerful as you can create applications directly from these data products to be analysed.
For example, if you create a Data Product for Finance that contains all the tables for a financial-based schema, a user can simply create a Qlik app from there to start analysing that schema of data.
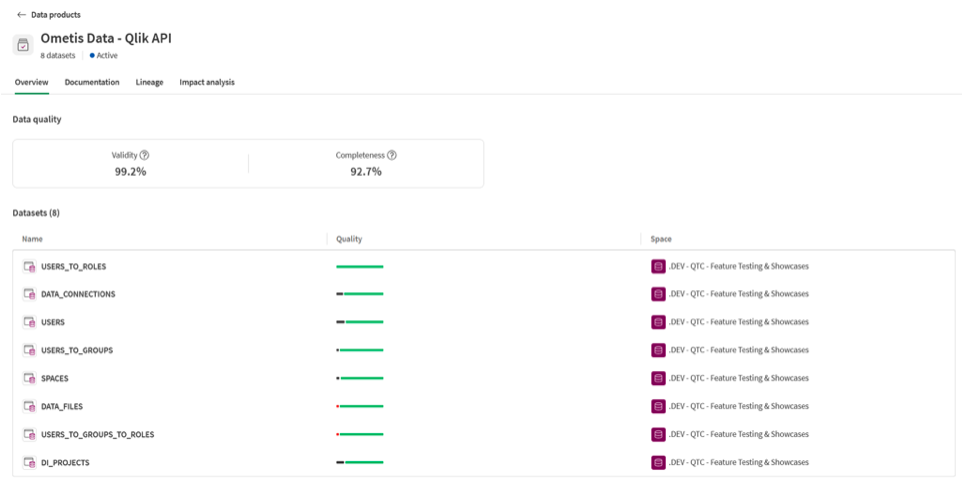
Quality bar vs Trust Score
One detail that can confuse users at first is the difference between the quality bar and the full Trust Score.
The quality bar is a quick visual for validity and completeness, not the complete Trust Score.
Each dataset has its own Trust Score breakdown, which you can view by opening the dataset directly.
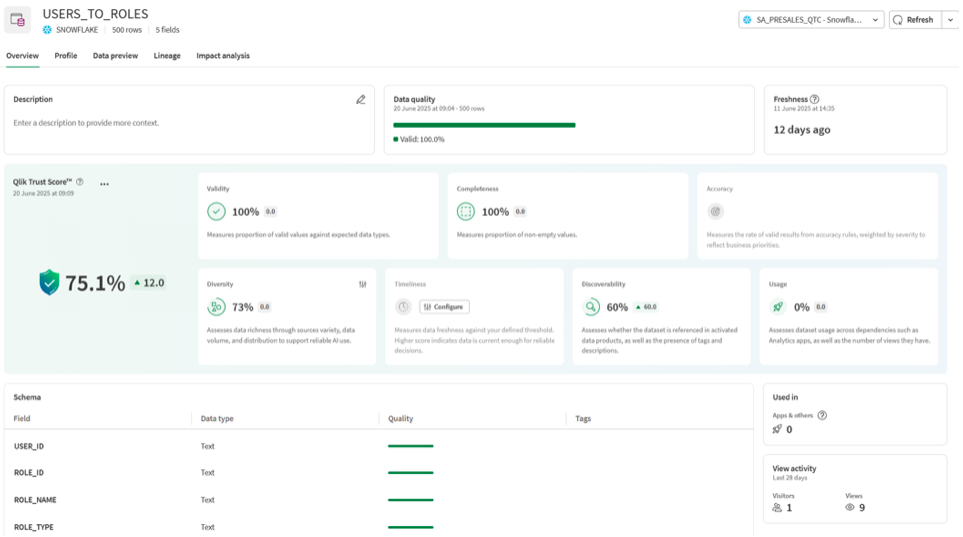
Using Trust Score dashboards to improve data quality
The Trust Score dashboard can look busy at first, but it’s extremely useful once you know what to look for.
You can find:
- KPIs for each Trust Score dimension
- configurable options (including sampling for diversity)
- a fast way to spot where data quality issues might be happening
Take a moment to give it a read through and fully understand where things are and what things mean. It’s useful both for users and developers and you can use the insights to make changes to the data pipeline and correct any quality issues.
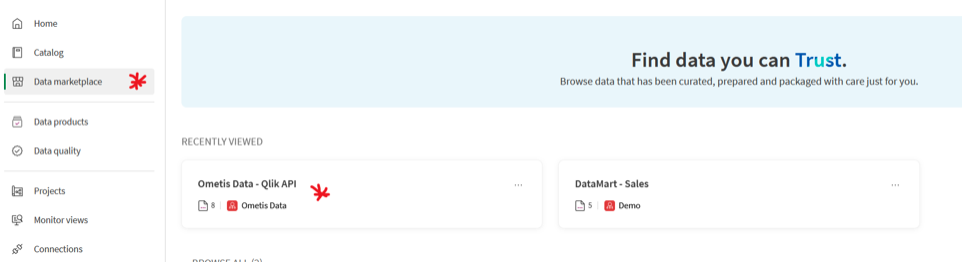
Publishing to the data marketplace in Qlik Talend Cloud
Once you’ve created a data product and validated its datasets, you can activate it and publish it to the data marketplace.
This is a managed space to publish your data products and grant users access to see and use that data downstream.
When you activate a data product, Qlik publishes a copy into the managed space you select during activation.
This is a practical way to improve governance and reduce confusion.
Getting started with Qlik Talend Cloud
Qlik Talend Cloud data quality tools have never made it simpler to assess, monitor and deliver trusted data.
Whether you implement all seven dimensions or focus on the mandatory ones, Qlik Trust Score gives you the framework to maintain data quality standards that match your business needs.
At Ometis, we help organisations implement Qlik Talend Cloud data quality frameworks that align with their specific industry requirements. Our experience across hospitality, higher education, manufacturing and financial services enables us to configure data products that drive real value from quality-assessed data.
Whether you're just starting with Qlik Talend Cloud or looking to optimise existing deployments, we’re here to accelerate your data quality journey.
Ready to start providing your organisation with trusted and governed data? Speak to one of our experts or apply for a Qlik data audit.


Comments