

The problem
Qlik Sense charts have plenty of ways to accumulate values over time. But there's a common scenario that trips people up: you want the accumulation to run across the full history, but you only want to show part of that history on the chart.
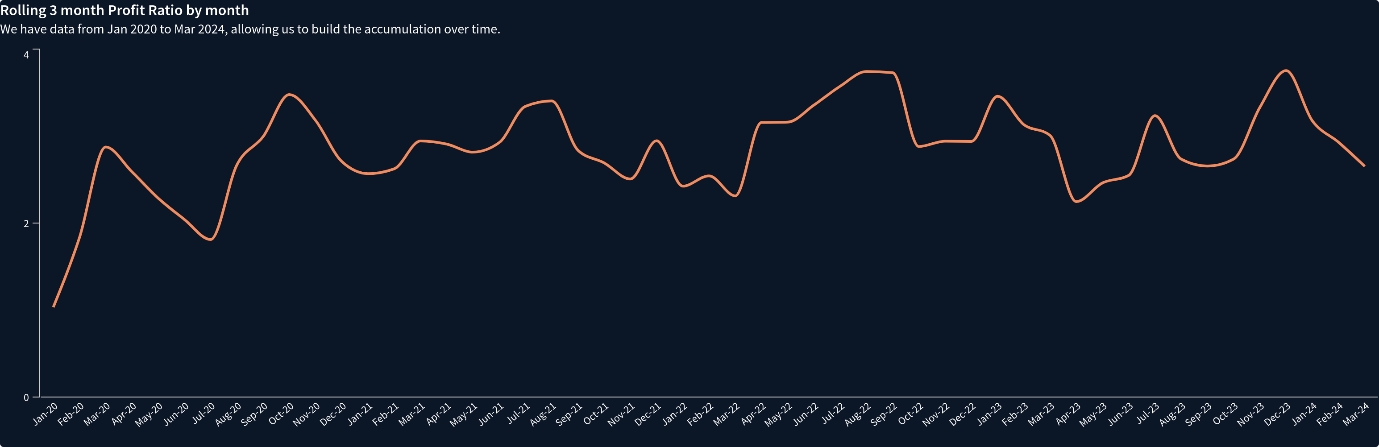
We have data from Jan 2020 to Mar 2024, allowing us to build the accumulation over time.
If you filter the date range the normal way, the accumulation restarts inside that range. That isn't what you want.
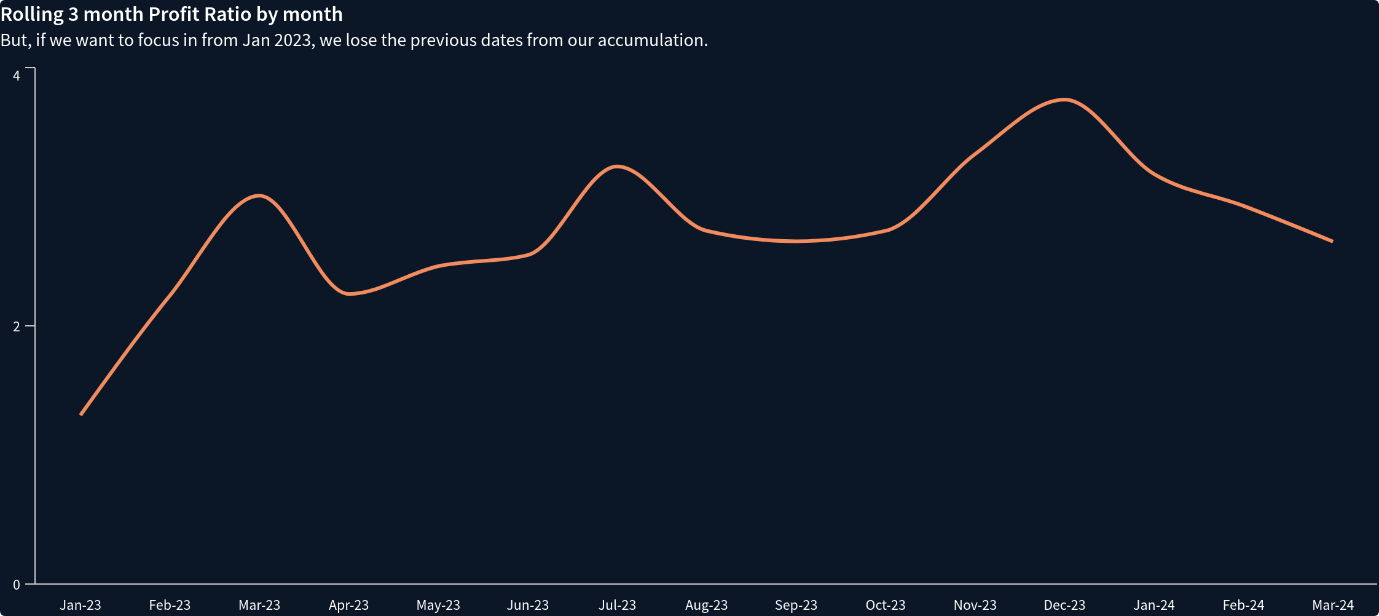
But, if we want to focus in from Jan 2023, we lose the previous dates from our accumulation.
Here's the approach we use to keep the maths correct and the view tidy.
Step 1: build the accumulative expression
Start with an expression that accumulates the profit ratios over the period you care about. RangeSum() and Above() do the work:
RangeSum(Above(Sum([Profit Ratio]), 0, 3))This gives you the running total across the full data, regardless of what you later choose to display.
Step 2: add a filter for the visible range
Next, add a filter that changes what's visible on the chart without touching the accumulation itself:
AVG({<[Date]={">=01/01/2023"}>}1)This returns 1 for dates inside the visible range and nothing outside it. Think of it as a switch that hides the earlier rows rather than removing them from the calculation.
Step 3: combine the two
Multiply the accumulation by the filter:
RangeSum(Above(Sum([Profit Ratio]), 0, 3)) * AVG({<[Date]={">=01/01/2023"}>}1)The result is a chart that shows only the range you want, with cumulative values that reflect the whole history behind them.
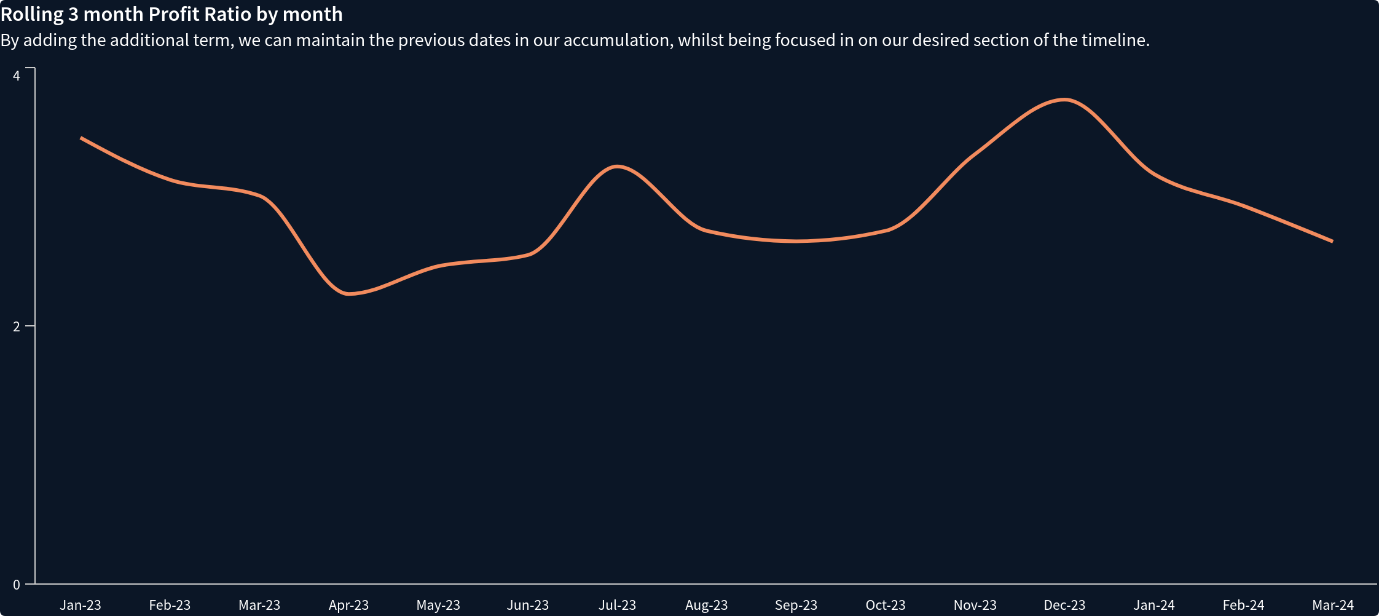
By adding the additional term, we can maintain the previous dates in our accumulation, whilst being focused in on our desired section of the timeline.
When to use this
Any time the story you're telling depends on what came before the visible window. Cumulative profit, running headcount, year-to-date measures where the year started outside the visible axis.
FAQ
Why doesn't a normal set analysis work here?
Set analysis narrows the data before the accumulation runs, so the running total restarts inside the filtered range. This approach keeps the accumulation on the full dataset and hides rows at the display layer instead.
Can I use this pattern with other aggregations?
Yes. The same idea works with Sum, Count, or any measure you want to accumulate — swap the inner aggregation and keep the multiplier the same.
Where does the filter date come from?
In the example it's hardcoded. In a real app you'd usually drive it from a variable tied to a date picker or a button, so users can change the visible window without editing the expression.
Need a hand with Qlik?
Expressions like this one come up all the time. If you or your team hit them regularly, there are a few ways we can help.
Qlik training. Our sessions are run by a former Qlik trainer and tailored to your data, your apps, and where your team actually gets stuck. Beginner to advanced, virtual or on-site.
Qlik support. UK-based certified consultants, one-hour response on urgent issues. Useful when a dashboard breaks the day before a board meeting, or when you've inherited a Qlik environment nobody documented.
Qlik platform audit. If your Qlik environment is slow, adoption is patchy, or you're not sure whether it's set up well, we run an independent audit. You get a 20+ page report with a prioritised action plan.



Comments