This Week vs Last Week in Qlik Tables (using BEFORE function)
In the latest Ometis blog, Chris Lofthouse explains how to use Qlik tables to generate comparations in your data.
I was with a prospect recently who wanted to display a pivot table limited to the last full month, with a generic dimension on the left-hand side and the week commencing dates across the top, along with several measures underneath. Pretty standard so far.
Where things became more interesting was when one of those measures needed to be a variance of the previous weeks’ numbers! So I thought it would make for a useful post for new Qlik users attempting to compare data from Qlik tables. For reference, I have displayed the output below.

My quick-fire solution comprised of using some Set analysis to reduce the data to the last complete month and using the BEFORE() function to access the previous week’s numbers.
Firstly, we will limit the data to the last complete month. Since I am using the time-aware calendar script from OmetisToolkit.com, which is set to use the max date in my data as my reference date, I don’t need to calculate the max date. Instead, we will use the ‘WeeksAgo’ field and simplify that part of the expression.
Example set analysis to reduce calculation to last complete month:

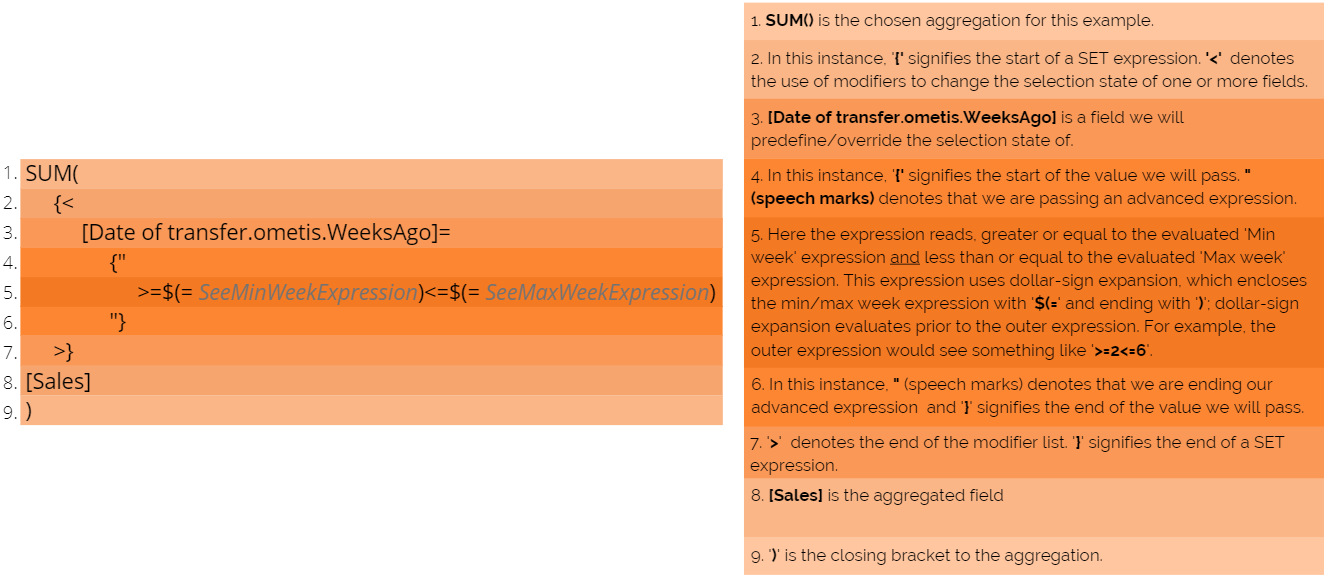
Here we are calculating the sum of sales, where the ‘WeeksAgo’ field is greater or equal to the minimum week expression and greater or equal to the maximum week expression. Those nested expressions are as follows:
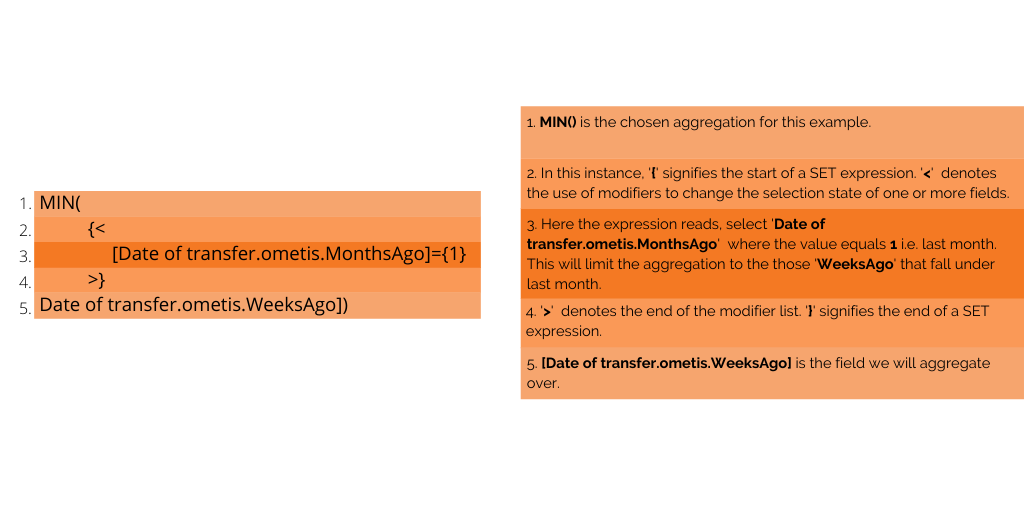
Qlik tables – Minimum week expression

The ‘Min week’ expression is used to calculate the minimum weeks ago value we need to reduce the data set by. For example, given the ‘current’ date of 21/01/2020, we want the last (minimum) ‘WeeksAgo’ of the previous month. This will result in ‘3’. As week commencing 30/12/2019 is the last week in the previous month to January, which is 3 weeks ago. The current week equals 0!
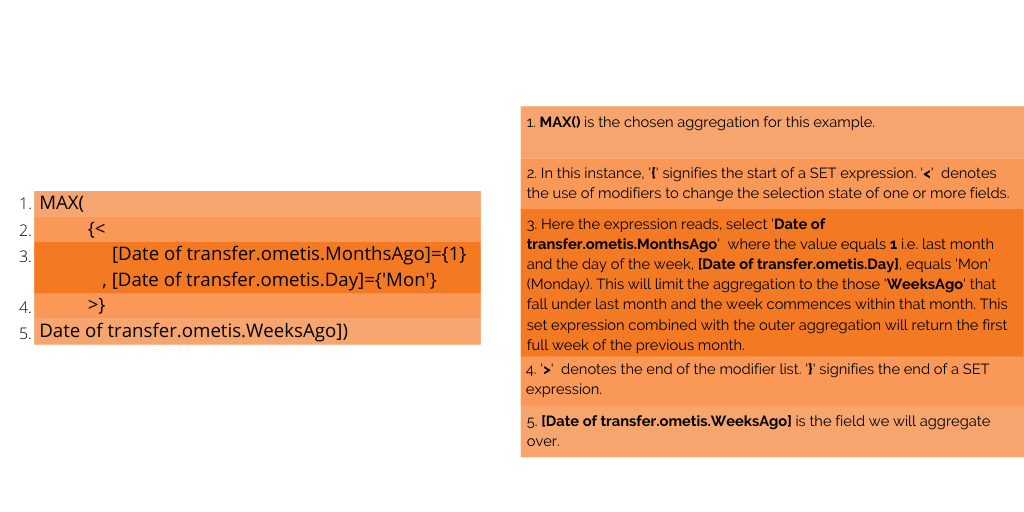
Max week expression

The ‘Max week’ expression is therefore used to calculate the maximum weeks ago value we need to reduce the data set by. The difference of this expression compared to the ‘Min week’ expression is that we want the first full week, where the week starts on a Monday. For example, given the ‘current’ date of 21/01/2020, we want the first (maximum) ‘WeeksAgo’ of the previous month. This will result in ‘7’. As week commencing 02/12/2019 is the first full week in the previous month to January, which is 7 weeks ago.
Now we have the data in the Qlik table limited to the previous month, we can proceed with calculating the variance week on week using the BEFORE function.
Qlik table – Previous weeks sales

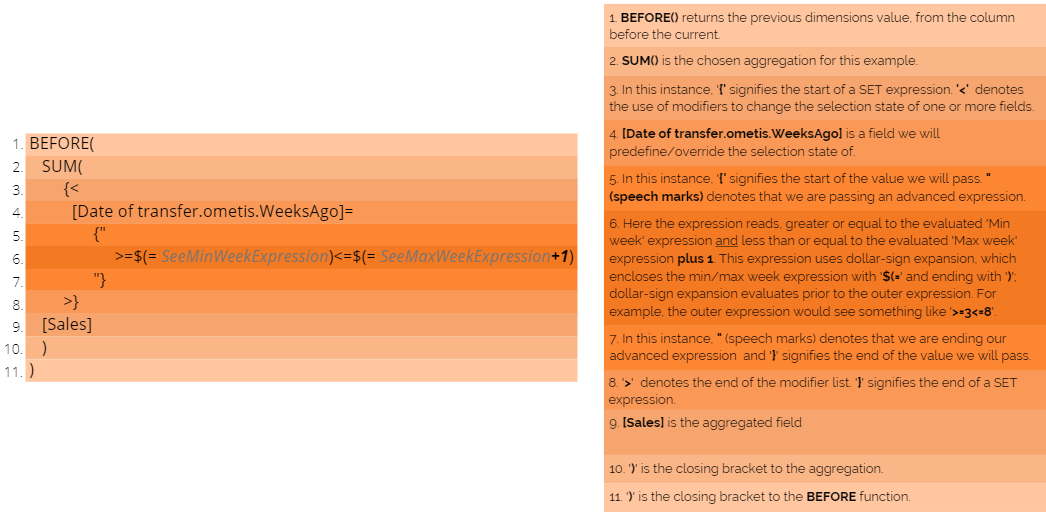
This expression shares many similarities to the first expression above, the main two differences being that we wrap the aggregation with the BEFORE function. The BEFORE function returns the previous dimensions value, the column before the current. In this example it will return the same measure but the value belonging to the previous week.
For example, for week commencing 09/12/2019 it will return the previous week’s numbers, that of 02/12/2019. The second difference is that we add one to the result of the ‘Max week’ expression, this is so last week’s numbers are returned for the first week we have reduced the data set by, otherwise the first week would have null values, which is not ideal:

Now we have both the current week and previous week under a single dimension value, we can subtract one from the other to create a variance column. And, better yet, with some additional styling to the variance column – a finishing touch which improves readability of the table greatly 🙂 #winning
If you want to know more about how Qlik can help you and your organisation please get in touch. Meanwhile, remember to hit the like button if you have enjoyed this post and remember to follow us for more content in the future.
By Chris Lofthouse
Follow @clofthouse89


Comments