

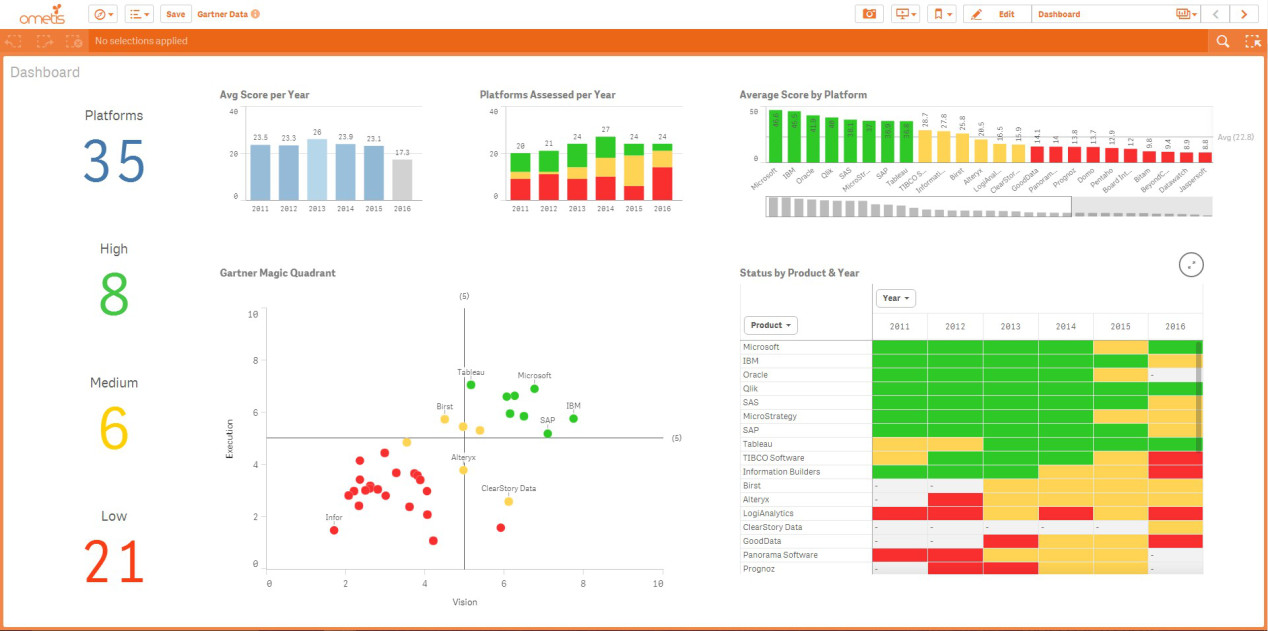
As a Qlik enthusiast my first port of call when I wanted to further analyse the results was always going to be Qlik Sense. Within a few minutes, I had used the Qlik Data Manager to connect to my Excel file and import the data into Qlik Sense – all without having to write a single line of script. Immediately, this gave me huge insight into the data and I found myself naturally drawn to several important insights. A few of which include:
Gartner is getting tough Where are the Challengers? Consistency is Key
These are explained in detail later on.
Gartner Analysis
The Magic Quadrant image below (Gartner, 2016) shows the results published in the last few days.
As you may guess from the name, the chart is divided into four quadrants, which allows Gartner to group the vendors into the following four categories: Niche Players, Visionaries, Challengers and Leaders.
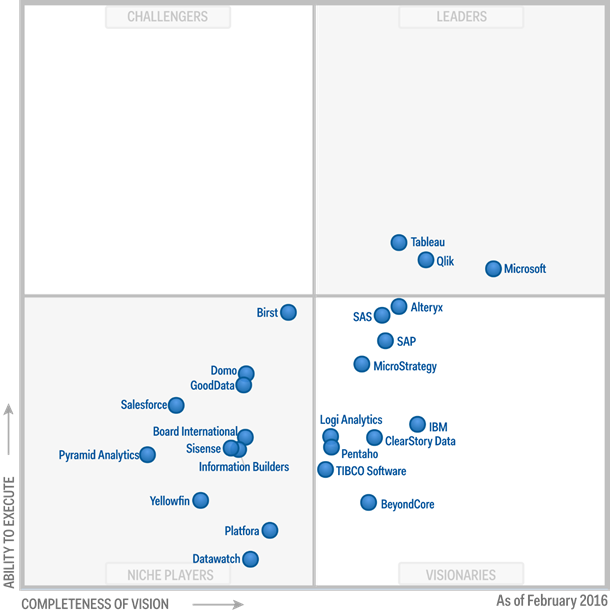
The 2016 report makes great reading for everyone involved with the Qlik Platform. For the 6th year in a row, Qlik has been positioned in the ‘Leaders’ quadrant, and that is certainly something to shout about. However, this also got me thinking about how some of the other vendors are performing, how the overall landscape (according to Gartner) is changing, and why Qlik continue to remain a leading player in this field.
The Data Explained
In order to understand more about the trends over time, I collected the last 6 magic quadrants together and extracted the source data from the results. To do this, I considered both the Completeness of Vision and Ability to Execute axes as values from 0 to 10 – with 10 considered maximum performance.
I then noted down the positions of each platform against the two axes and collected the results in a simple Excel file.
Scoring System
In addition to those two metrics, I needed a single metric to compare and contrast the relative performance of each vendor. While it’s clear that platforms in the ‘Leaders’ quadrant are the highest performing, it can be difficult to directly compare platforms across all the different quadrants.
To normalise the results, I multiplied the two scores together to produce a Total Score for each platform. To give an example, a vendor positioned directly in the centre of the chart would score 5 for Vision, 5 for Execution and 25 (5×5) as a Total Score.
Finally, I graded the vendors across High, Medium and Low performing categories using 15 and 32 as the score boundaries. This can be visualised as follows:
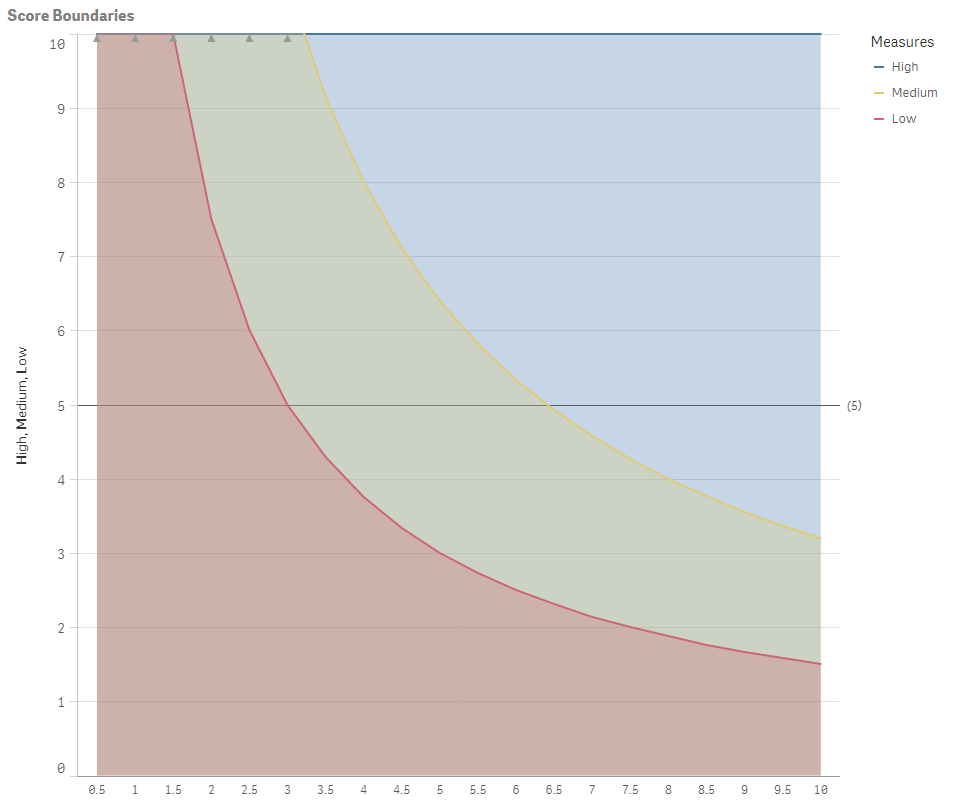
N.B – I’ve used the terminology High, Medium and Low as arbitrary categories to give some understanding for you, the reader. I have no doubt you’ll have your own thoughts on this.
So far, so good…but now we get on to the good stuff!
Gartner is getting tough
The first thing I noticed was that the average score across the platforms showed a marked decrease in 2016 – down to 17.3 from 23.1 in 2015.
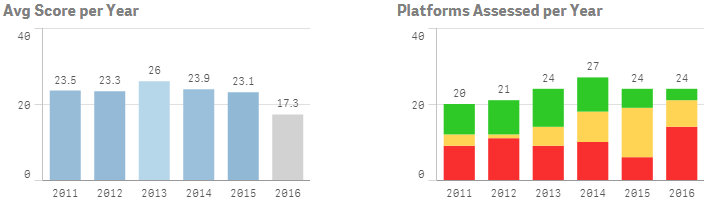
You can then see this borne out by the relative split of the three coloured segments in 2016 (right hand chart). There’s a significant increase in those found to be Low performing (Niche Players) and only 3 platforms are considered High performing (Microsoft, Qlik and Tableau).
To investigate further, I plotted the average results of each year:
From this chart, we can see that 2016 is the obvious outlier. Interestingly, we can observe that 2016 actually has the highest average Vision scores, but there has been a significant reduction in Gartner’s assessment of the overall market’s ability to execute. This poses some interesting questions of how Gartner is choosing to evolve its assessment criteria and why they believe the market has shifted in this way. Gartner certainly seem to have ‘got tough’ in 2016.
Where are the Challengers?
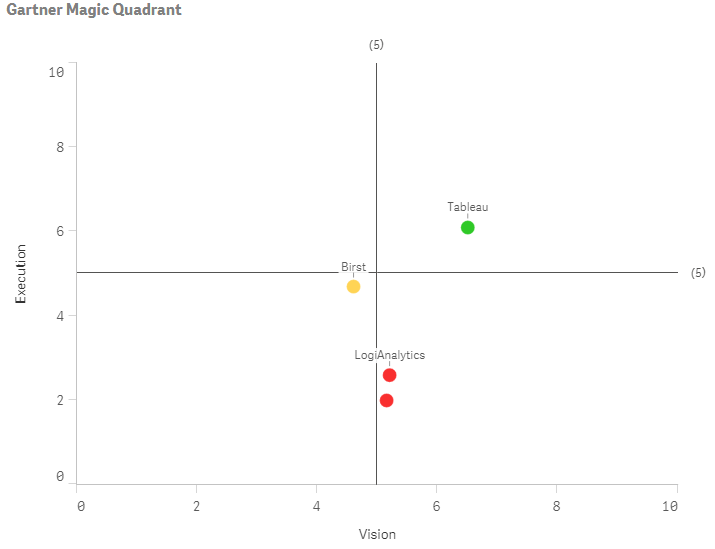
My next insight came by selecting each year in turn and observing the movements of the dots for each platform. It was fascinating to see the evolution of each product over the 6-year period. While doing this, I noticed one anomaly – that 2016 is the only year that has no platforms positioned in the ‘Challengers’ quadrant (top left). Birst is the closest we have to a ‘Challenger’ in 2016, but it seems to have fallen foul of Gartner’s stringent Execution criteria on this occasion.
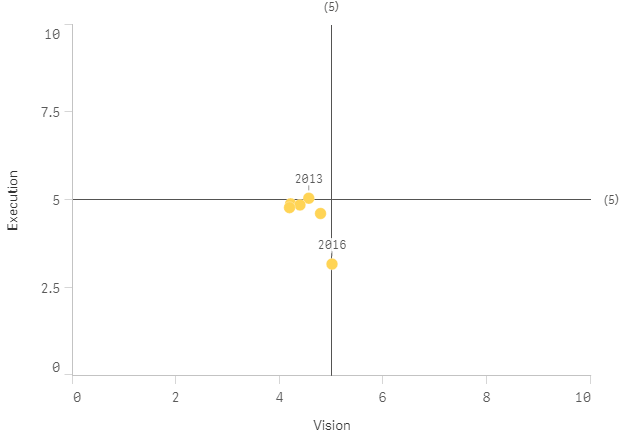
I wanted to do some further digging into the performance of those products that had (at some point in the last 6 years) been considered Challengers. To do this, I quickly cycled through each year and selected those platforms that appeared in the Challengers quadrant. There were 4 vendors; TIBCO, Tableau, Birst and LogiAnalytics. Finally, I selected just the 2016 year to find out where they are all positioned today. The results are interesting:
Of the 4 products that have been considered challengers, only Tableau has managed to force its way into the Leaders quadrant. Birst may still have a chance, and it will be interesting to see how its position will develop over the next 12 months, but a 1-in-4 conversion ratio from Challenger->Leader is going to make it tough for any new vendors in the market place. Both LogiAnalytics and TIBCO appear to have stagnated as other vendors evolve their products and highlight potential issues with their relative ability to execute.
Consistency is key
One area I wanted to focus on was the performance of Qlik. Ok, so I have a vested interest in monitoring Qlik closer than some of the other vendors, but this still showed some significant insights.
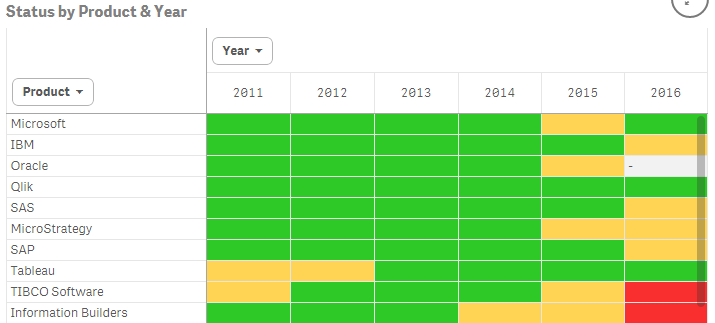
The first thing that stood out came when I plotted the status of each platform across all the years. Here I’m just showing the top 10 vendors, sorted by average score:
Blog Consistency
The thing that stands out is that (based off the normalised calculations) Qlik is the only vendor to achieve a High performing (green) status in each of the last 6 years. This is quite remarkable given the company that Qlik is keeping.
In addition, some of the other High performers from previous years (IBM, SAS, MicroStrategy, SAP, TIBCO and Information Builders) certainly appear to be slipping away when you look at their positions in 2016:
Qlik v Tableau
The rise of Tableau into the High performing category has certainly been impressive over the last few years, and no-one can deny they have a compelling offering for some customers who require little in the way of data transformation. Given that there has been a significant overall reduction in scores across all vendors, I was keen to assess the relative movements of Qlik and Tableau over the last 12 months
This first image shows the 2015 position, where Tableau hold a strong position:
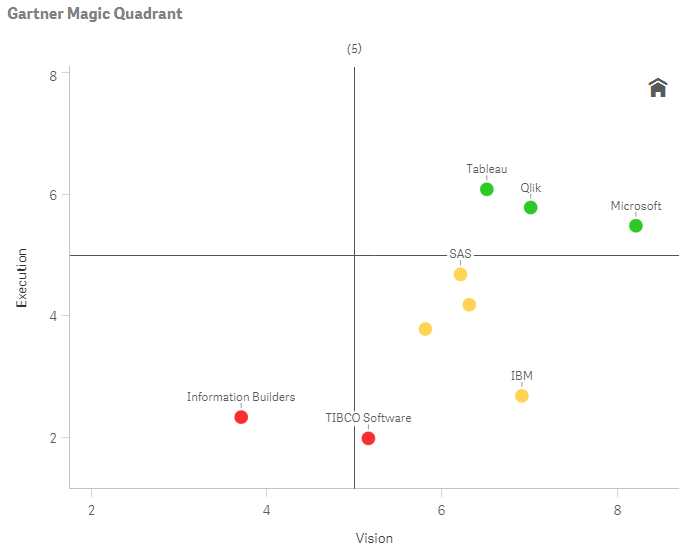
Next we look at the updated view for 2016:
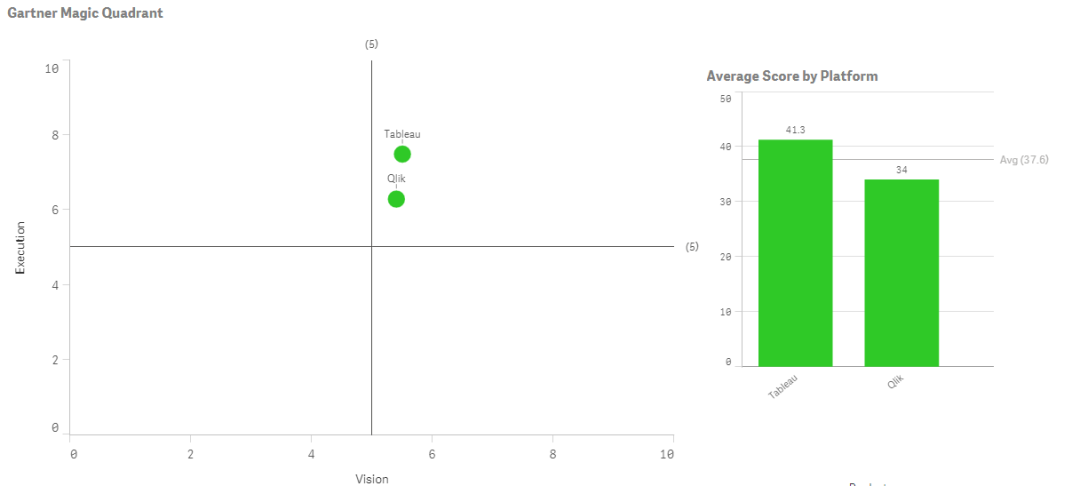
In 2016, Tableau has followed the same movement in profile as many other vendors – a small increase in Vision, but a reasonable drop in Execution performance. On the other hand, Qlik has shown a strong increase in their Vision with only a small decrease in their Execution performance.
I believe the improvement in Qlik’s Completeness of Vision is down to their new and improved platform approach. The acquisition of NPrinting for content distribution, the release of Qlik Sense Cloud for application sharing and remarkable sales of the newer Qlik Sense product seem to have impressed our colleagues at Gartner as they now rank Qlik above Tableau once again.
Summary
There is no denying that our industry pays attention to reports such as this one produced by Gartner. For anyone related to BI it is always interesting to see an objective view of the market. Like the tools we use, sell, or implement on a daily basis, this information helps us make more informed decisions. As the UK’s largest dedicated Qlik consultancy we pay particular attention, and remain impressed by the results. Qlik consistently enhance their leading platform, and the successful implementations we deliver to our customers are a testament to that.
It will be interesting to see how Gartner’s evaluation criteria develop this year, and if some of the vendors who have fallen away can fight their way back into the Leaders quadrant. I think we all appreciate that BI and Analytics is going to remain a hot topic for many organisations throughout 2016 and we look forward to the challenges and success that will bring.
Next Steps
If you are interested in obtaining a full copy of the Qlik Sense application from which this analysis is based, then we would love to hear from you. If you are not already a Qlik Sense user, then no problem, our team will be happy to support you in installing the free desktop version so you can start exploring this data (and your own) in much more detail.
Contact me directly, or email info@ometis.co.uk for further information.
Thanks for reading!
Ross

Comments