Qlik Best Practice: Measures and Dimensions in Qlik Sense
In the latest of our Qlik Best Practice series, we offer some guidance on Measures and Dimensions in Qlik Sense.
Often, one of the prime contributing factors that affect the adoption of a Qlik Sense dashboard resides in the measures and dimensions that are defined.
Just to offer some context, the definition of the Measures determine the accuracy and trustworthiness of the numbers, while the Dimensions represent the quality and depth of the data that’s being reported upon. Get these wrong and it can prove detrimental to the success of your Qlik Sense dashboard.
Measures and Dimensions in Qlik Sense
Here are our Qlik Sense best practices for measure and dimension creation:
- Create and maintain a collection of master measures to enable self-service. Master measures allow for a single-version of the truth. These reusable measures can be quickly and easily accessed by end-users in a single (governed) area of an application – ultimately saving time developing and maintaining visualisations. Remember to add tags for searching, and descriptions which can be shared through the ‘show details’ option of each visualisation. As a general rule of thumb, I create a master measure for every expression that is used in more than one object. However, for true self-service it could be argued that all expressions should be held in a master measure so other users can reuse them at will.
- Create and maintain a collection of master dimensions, both single and drill-down. Master dimensions help promote key fields to end-users while developing and making selections in the selections tool.
- Implement a naming convention which is intuitive for end users. This applies, but is not limited to, master dimensions, master measures, visualisation labels and variables.
- Use expression labels to improve the intuitiveness of an application by explicitly stating what it represents; removing any ambiguity. For example, using an expression label to show ‘2019 sales’, as opposed to ‘Current year sales’ or ‘TY sales’.
- Variables should only be used in the front-end of Qlik Sense to reduce duplicated logic when a Master Measures cannot be used. Examples of permitted use-cases currently include storing the logic for reference lines, conditional-colouring and set-analysis.
- Avoid IF statements in measures. IF statements can be highly inefficient, it is therefore advised to move the logic to the reload script where possible. Otherwise it risks expressions taking a noticeable length of time to calculate which will cause users to become frustrated and abandon the application.
- Avoid calculated dimensions. Like IF statements, calculated dimensions can be highly inefficient. Therefore, it is advised to move logic to the script where possible.
- Avoid using the COLUMN() statement in expressions. If the column order is changed, the calculation will potentially not work as expected. It is advised to use a Master Measure, variable or the column label instead.
- Remove any reliance of expressions working via external sources like Excel (where the logic is held in the data model). This restricts self-service capabilities, eliminates the agility of the software and maintaining the logic becomes cumbersome, with changes potentially affecting other apps/measures unintentionally.
- Reduce the use of extensive expressions used for sort orders. Sometimes this is unavoidable. However, more often than not, it is possible to use the LOAD order or DUAL statement to make custom sorting easier and more efficient.
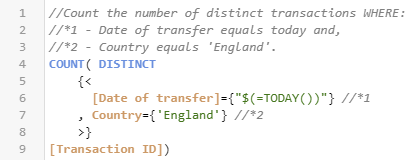
- Remember to comment and format expressions/measures consistently to ensure they are easily read and maintained, a detailed example has been provided below:

Example of a formatted measure/expression. By following these guidelines you will equip yourself, and your end-users, with the necessary means and knowledge to build reliable and reusable measures and dimensions in Qlik Sense – taking the effort out of data visualisation.
To stay up-to-date with all the latest Qlik tips and tricks please remember to follow us on LinkedIn, Twitter and YouTube.
By Chris Lofthouse
Topic: Data analytics


Comments